Let’s face it. For all of our talk about the importance of data, we’re still “data dumb,” meaning we collect the wrong data, let our data collect dust, or fail to interpret it correctly. Many companies gather data only to share it with a few people instead of using it to engage the entire team in performance improvements.
- It’s the hospital experiencing unacceptably high hold times and clogged phone lines that wants to invest in a new phone system without first exploring the cause of its long hold times.
- It’s the company exceeding budgets that battles vendors over the escalating cost of materials without investigating why they use so much material in the first place.
- It’s the team that doesn’t track data so they don’t know they are 400% over scrap budget.
The impact of dumb data—missing, unused, or incorrect data—on performance, results, and revenue is enormous. Businesses miss opportunities because they either don’t know a problem exists or focus on the wrong problem. They waste time, energy, and resources to treat the symptoms and miss the root cause, then get frustrated when nothing improves.
Results with a Z: The role of lean data in performance improvement
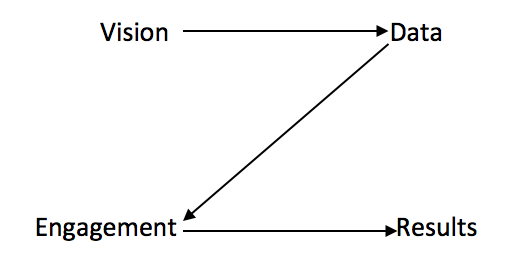
Results don’t just happen because we plan for them. It’s not a straight line from vision to result, rather a “Z”. This process breaks the vision down into key performance indicators, generates measurable data based on those metrics, and engages the team to use and act on the data, which ultimately leads to results.

You almost certainly have data, maybe even “big data”, but is it lean data? Companies must learn to utilize lean data – data that is relevant, timely, reliable and consistent – in a structured way so it is not only created, but also used and acted upon. Employees at every level must be engaged with this data.
Act on your lean data and finally get the results you want
Lean data doesn’t just drive decisions. It gets you focused on the root cause of your performance issues, allowing you to set goals and accurate priorities for the team. You are then able to drive the kind of action that results in real performance improvement.
The Dorsey Group has created a toolkit that puts lean data and engagement to work, helping create the process and infrastructure needed to drive results. The 50 tool templates in our toolkit include:
- Process Mapping: This basic building block creates employee engagement and develops a common language.
- Weekly Scorecard and Daily Seeing Eye: Clearly communicates expectations and tracks performance levels over time.
- Visual Control Board: An open, visible communications hub that displays performance levels, issues, and priority projects.
- Work Center Monitor: This is the voice of the employee; it documents performance issues that interfere with employees doing their job.
- Strategy Deployment Matrix: A tool to demonstrate alignment between organizational goals and priority projects.
- Crewing and Capacity Guide: A reality check that compares a team’s supply capacity and crewing levels with the demand capacity being requested.
- Problem Solving Storyboard: Visible and systematic problem-solving process to identify and eliminate root causes for priority problems.
Real life success stories using lean data
Regarding the hospital with clogged phone lines: We used Work Center Monitors to create lean data that could be stratified, allowing us to explore why they were getting so many phone calls. Turns out that people on hold for billing issues were tying up the phone system. When we further studied the lean data and solved the billing issues, phone system performance dramatically improved. The long hold times and system underperformance were just symptoms of a larger issue, and the hospital was able to avoid the large expenditure for a new phone system.
The company that wasn’t tracking data began to use a Weekly Scorecard to monitor scrap levels. While their scrap levels tended to be consistent, they didn’t really know what the scrap budget should be. When they requested that information from their finance team, they realized they had a significant problem: They were going to miss their budget by over 400%.
They needed to act quickly. And because they had lean data in their Weekly Scorecard, they were able to identify a problem that had existed but gone unseen before using the scorecard. Once the team identified that there was a significant issue, they were able to stratify down to the root cause and develop preventive actions that either eliminated or minimized the problems.
And the team did this on their own, because they had the lean data and tools they needed to analyze it.
Become a smart data company: Generate lean data and use it
Ultimately, not all data is created equal. Looking at your numbers at the end of the month is like looking at an autopsy. What’s done is done; you either hit the goal or you didn’t. There’s nothing you can do to change or influence the outcome. And that’s where data dumb companies leave it.
In contrast, companies that use lean data to drive action are proactive. They build a company culture that empowers employees to create, use, and act on their data. Because they’re engaged and always looking at the data, they’re able to quickly identify significant issues, prioritize the ones that will have the greatest impact on performance, and make adjustments to meet their targets.
And that always gets results.
So what kind of company are you going to be?
The Dorsey Group can help unleash your team’s potential and power peak performance. For more information, contact us at www.TheDorseyGroup.org or (954) 629-5774.

